This is a follow-up to a recent post on the income-expenditure (IE) model and is at a similar introductory level. Some knowledge from the previous post is assumed, so for those unfamiliar with the model, it would be best to read that post before this one. The purpose is to explain how the model can be represented graphically in a two-panel diagram. The top panel shows equilibrium and disequilibrium adjustments in terms of income and planned expenditure. The bottom panel shows them in terms of planned leakages and injections.
The four-sector IE model is described by equilibrium condition (1) and behavioral equations (2)-(7):
(1) Ye = Ed = Cd + Id + Gd + (Xd – Md)
(2) Cd = Co + c(Y – Td)
(3) Td = To + tY
(4) Md = Mo + mY
(5) Id = Io
(6) Gd = Go
(7) Xd = Xo
Cd, Id, Gd, Xd, Md and Td are desired consumption, investment, government spending, exports, imports and taxes. All variables are in real (meaning price-deflated) terms. The ‘o’ subscripts indicate exogenous variables. They are autonomous of income. The parameters c, t and m are the marginal propensities to consume, tax and import.
It is also useful to note the saving function which follows from the consumption function in (2), noting that Sd = Y – Td – Cd. Substituting the consumption function into this expression and rearranging gives:
(8) Sd = -(Co + sTo) + s(1 – t)Y
where s (= 1 – c) is the marginal propensity to save.
The IE model can be represented by a two-panel diagram that includes schedules for desired total expenditure (Ed), leakages (Wd, for ‘withdrawals’) and injections (Jd), all expressed as functions of income.
The expression for Ed is found by substituting (3) into (2), then (2) and (4)-(7) into the right-hand side of (1) and rearranging:
(A) Ed = (Co + Io + Go + Xo – cTo – Mo) + (c(1 – t) – m)Y
This is a straight line, as are all the schedules. The sum of terms within the first set of parentheses is the vertical intercept. A change in any of them will cause shifts in Ed. The expression in the second set of parentheses is the slope.
There are three injections in the model:
(B) Jd = Io + Go + Xo
There are also three leakages. Adding the expressions for planned saving (8), taxes (3) and imports (4) and rearranging gives:
(C) Wd = (-Co + cTo + Mo) + (1 – c(1 – t) + m)Y
The first bracketed sum is the vertical intercept and the second is the slope.
Expressions (A), (B) and (C) can now be used to graph the model. An initial equilibrium situation looks like this:

In the lower panel, the Jd schedule is horizontal because injections are assumed exogenous and so independent of income. The Wd schedule is upward sloping because as income rises, there is some leakage to saving, taxes and imports. Equilibrium occurs at the point of intersection where desired leakages equal desired injections.
In the upper panel, a 45-degree line shows all the points at which actual total expenditure, E, equals income. Because of leakages, the Ed schedule is flatter than the 45-degree line. In other words, its slope is less than 1. In equilibrium, Ed equals both actual expenditure and income.
Notice that equilibrium income is below the full-employment level, Yf. The model’s income-adjustment process is applicable to situations where there is unemployment and excess capacity. At full employment, there would be no room for further increases in real income. Consistent with the model’s Keynesian causation, there is no automatic tendency for the economy to move to the full-employment level of output. Full employment would only happen by fluke or by government policy design.
Increase in planned injections. Suppose there is an exogenous increase in one or more of the desired injections. It could be an increase in investment or government spending or a combination of the two. It doesn’t matter which in the model since all the exogenous injections are assumed to have the same multiplier effect. (More elaborate versions of the model allow different multipliers for different types of spending.)
The effect of the increase in planned injections is shown below:
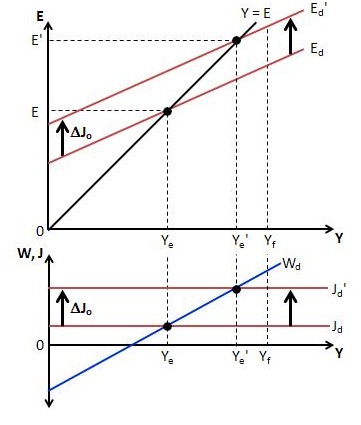
In the lower panel, the Jd schedule shifts up. At the initial equilibrium income, Ye, Jd would exceed Wd, indicating disequilibrium. However, the extra injection of demand causes a multiplied increase in income. This adjusts desired leakages to the higher level of desired injections. This is represented by a movement up along the Wd schedule. The process is complete once equilibrium is restored.
In the upper panel, the extra injection of spending causes an upward shift in the Ed schedule from Ed to Ed‘. It is again clear that the initial income level, Ye, can no longer constitute an equilibrium position because at that level of income desired total expenditure exceeds income. The excess demand causes an unanticipated depletion in inventories and firms are assumed to respond by expanding production. This causes income to rise, represented by a movement up along the 45-degree line. The income growth induces additional consumption, represented as a movement up along the Ed‘ schedule, but also some leakage, ensuring that income, moving with steeper slope, eventually catches up to desired total expenditure. As a result of the process, a new equilibrium is reached in which income is fully adjusted to desired total expenditure.
Increase in autonomous consumption.. An increase in autonomous consumption has the same effect in the upper panel as an increase in planned investment, government spending or exports, but plays out differently in the lower panel.
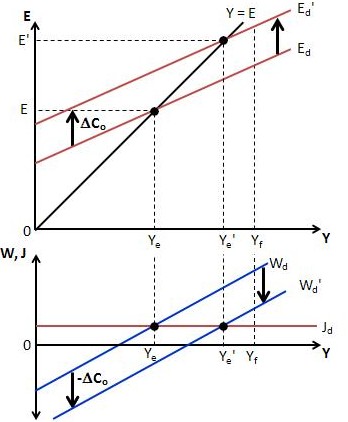
In the lower panel, an increase in autonomous consumption causes a downward shift in the Wd schedule. This is because –Co is a term in the saving function. An increase in autonomous consumption is equivalent to a decrease in autonomous dissaving.
With the Wd schedule below the Jd schedule at the initial equilibrium income, Ye, there is a multiplied increase in income. This induces additional leakages. At the new equilibrium, there is higher income but the same amount of injections and leakages as in the initial equilibrium, due to the increase in autonomous expenditure.
A reduction in the marginal propensities to leak.. If one or more of the marginal propensities to save, tax and import are reduced, due perhaps to a structural, cultural or institutional change, the slope of the Wd schedule gets flatter and the slope of the Ed schedule gets steeper. There will be a higher equilibrium income for any level of net autonomous expenditure: a larger multiplier.

